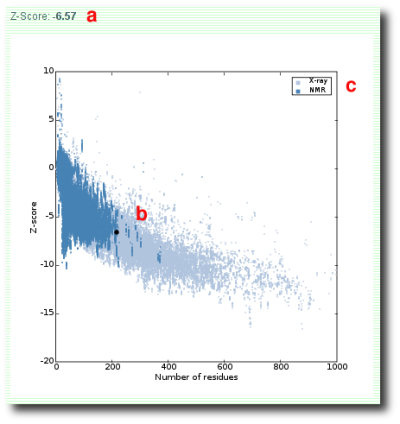
Figure 1: Screenshot of ProSA-web z-score plot.
The recognition of errors in experimental and theoretical models of protein structures is a major problem in structural biology. ProSA-web provides an easy-to-use interface to the program ProSA (Sippl 1993) which is frequently employed in protein structure validation. ProSA calculates an overall quality score for a specific input structure. If this score is outside a range characteristic for native proteins the structure probably contains errors. A plot of local quality scores points to problematic parts of the model which are also highlighted in a 3D molecule viewer to facilitate their detection.
ProSA-web requires the atomic coordinates of the model to be evaluated. Users can supply coordinates either by uploading a file in PDB format or by entering the 4-letter code of a protein structure available from PDB. A chain identifier and an NMR model number may be used to specify a particular model. A list with possible values of these parameters is presented to the user if the entered chain identifier or model number is invalid. If no chain identifier or model number is supplied by the user, the first chain of the first model found in the PDB file is used for analysis.
ProSA-web uses only the C-alpha atoms of the input structure, hence it can also be applied to low resolution structures and approximate models obtained early in the structure determination process.
The z-score indicates overall model quality (Figure 1a). Its value is displayed in a plot that contains the z-scores of all experimentally determined protein chains in current PDB (Figure 1b). In this plot, groups of structures from different sources (X-ray, NMR) are distinguished by different colors (Figure 1c). It can be used to check whether the z-score of the input structure is within the range of scores typically found for native proteins of similar size.
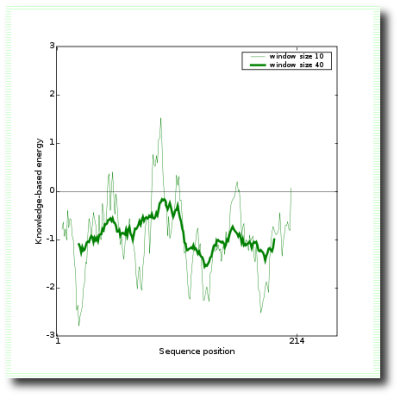
This plot shows local model quality by plotting energies as a function of amino acid sequence position i. In general, positive values correspond to problematic or erroneous parts of the input structure. A plot of single residue energies usually contains large fluctuations and is of limited value for model evaluation. Hence the plot is smoothed by calculating the average energy over each 40-residue fragment s(i,i+39), which is then assigned to the 'central' residue of the fragment at position i+19 (Figure 2, thick line). A second line with a smaller window size of 10 residues is shown in the background of the plot (Figure 2, thin line).
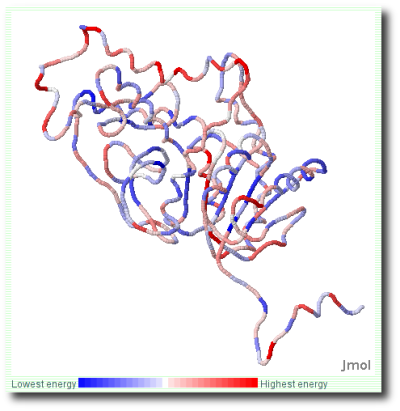
ProSA-web visualizes the 3D structure of the input protein using the
molecule viewer Jmol. Residues are colored
from blue to red in the order of increasing residue energy (Figure
3). By using the interactive facilities provided by Jmol (distance
measurements, etc.) problematic parts of the model can be explored in
more detail.
You have to activate JavaScript to view your structure with Jmol.